When the antenna is too large to measure: RF modelling of large deployable reflectors
For large deployable reflector antennas, full-scale RF measurement under operational conditions is often not possible. That makes the accuracy of the RF model a programme-level concern, not just an engineering detail. This post describes how TICRA developed and validated the RF modelling approach for two such antennas — the Large European Antenna and the breadboard for the Copernicus CIMR instrument.
A different kind of verification problem
Most antenna designs can be verified by building a prototype and measuring it. For large deployable reflector antennas intended for space, that is only partly true.
A large deployable reflector antenna is exactly what it sounds like: a reflector that is folded for launch and deployed once the spacecraft is in orbit. These antennas can reach several metres in diameter, well beyond what fits in a standard antenna measurement facility. More importantly, the operational environment cannot be replicated on the ground. A conically scanning instrument spinning at several revolutions per minute in orbit, in vacuum and at operational temperatures, behaves differently from the same hardware sitting in a test chamber under gravity.
This creates a verification problem. If you cannot measure the antenna under representative conditions, you need a model that is accurate enough to be trusted. The electromagnetic model of the antenna, which predicts how it will radiate in orbit, becomes part of the verification evidence. That means validating the model carefully, at a scale and in a configuration where measurement is feasible, before drawing conclusions about full-scale performance.
This is what TICRA did across two connected programmes: the Large European Antenna (LEA) project, which produced the first 5 m deployable mesh reflector fully developed in Europe and taken through a full qualification campaign, and the breadboard of the Copernicus Imaging Microwave Radiometer (CIMR), a future Earth observation satellite instrument. In both cases, TICRA built detailed RF models using GRASP and ESTEAM, the electromagnetic simulation tools within the TICRA Tools software suite, and correlated the predictions with measured antenna patterns.
What a large deployable mesh reflector actually is
Before going into the modelling, it helps to understand the antenna structure involved.
A mesh reflector, unlike a solid dish, uses a knitted mesh as its reflective surface. The mesh is attached to a front tension net, a network of cables arranged in triangular facets, which is itself supported by a deployable truss structure. The reflector surface is determined by the tension net geometry and by the pillowing effect of the subtended mesh. Its reflectivity is determined by the mesh material and weave.
This construction allows a very large aperture to be packaged compactly for launch, but it introduces RF modelling challenges that solid reflectors do not have. The mesh is not a perfect reflector. Its reflectivity depends on the wire diameter, the weave pattern, the grid spacing, and the angle at which the incoming electromagnetic wave hits the surface. The triangular facet structure of the tension net also creates a periodic geometric pattern across the aperture. In the antenna radiation pattern, this periodicity shows up as grating lobes, secondary maxima that appear at predictable angular positions away from the main beam, in addition to the ordinary sidelobes. Predicting their amplitude and position accurately requires an accurate representation of the reflector surface.
The triangular facet structure of the tension net creates a periodic pattern across the aperture. In the far-field pattern, this periodicity produces grating lobes, secondary maxima at predictable angular positions, whose accurate prediction depends on knowing the surface geometry of the net.
The Large European Antenna: first of its kind in Europe
Large deployable mesh reflectors have been in use in the United States for more than three decades. In Europe, the technology was less mature. To address this, the European Commission co-funded the Large European Antenna (LEA) project under the Horizon 2020 research framework, running from 2017 to 2021. The project was led by HPS GmbH and involved a consortium of 15 companies from six European countries, with the goal of designing, manufacturing and testing a prototype (protoflight model) of a 5.1 m deployable reflector in light mesh technology. It was the first antenna of its kind to be developed and measured in Europe.
TICRA was part of the consortium, alongside LSS (Large Space Structures), which supplied the deployable reflector, and Airbus Defence & Space in Ottobrunn, which hosted the RF measurement campaign. TICRA’s role was to provide RF predictions throughout the project and to correlate the predictions with the measured results.
The LEA antenna underwent RF testing in November 2020. Measurements were performed using the Portable Antenna Measurement System (PAMS) developed by Airbus, a crane-based system that positions a probe on an arbitrary acquisition surface above the antenna and samples the near field. The near-field data is then mathematically transformed to obtain the far-field radiation pattern. Near-field data was acquired at three frequencies, 10.4 GHz, 10.65 GHz and 11 GHz, on a 7 m × 5.5 m scan plane at a distance of 4.5 m from the reflector centre, for both horizontal and vertical polarisation feeds.
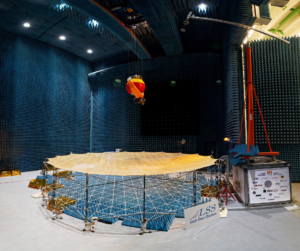
Figure 1 – LEA antenna build by LSS ready for RF test at Airbus in Ottobrunn, Germany. The crane-based gondola probe of the PAMS system is visible in orange, red and yellow.
Building the RF model in GRASP and ESTEAM
To predict the antenna patterns, TICRA built a detailed model of the LEA antenna in its measurement configuration. The model was constructed in GRASP, TICRA’s software for high-accuracy electromagnetic analysis of reflector antenna systems, and in ESTEAM, which provides full-wave electromagnetic analysis. Together, they form part of the TICRA Tools suite.
The model had four main inputs:
- Reflector surface geometry, obtained from laser radar measurements of the deployed antenna taken by HPS, with gravity compensation devices supporting the structure. The measurement produced a set of 9,179 surface points in three-dimensional coordinates. Where the surface of the front tension net could not be directly measured, points were recovered by extrapolating from adjacent triangular facets and averaging. Linear interpolation was used between measured points.
- Mesh electromagnetic properties, characterised from measured reflection losses at normal incidence. The LEA mesh is an Atlas-Atlas knit of gold-plated tungsten wires, 30 microns in diameter. At 10.65 GHz, the measured reflection losses were -0.01 dB for one polarisation and -0.1 dB for the other. GRASP uses an equivalent rectangular wire mesh model, a simplified representation that replicates the reflective properties of the real mesh, with the spacing parameters set to match the measured normal-incidence reflection losses. The reflection and transmission properties at other incidence angles are then computed using the Astrakhan formulas, a well-established analytical method for wire-grid structures.
- Feed horn radiation pattern, measured over a full sphere at Airbus and used directly as the illumination source in the model.
- Deployable truss and feed tower geometry, included only in the full-wave model to assess the influence of these structural elements on the radiated pattern.
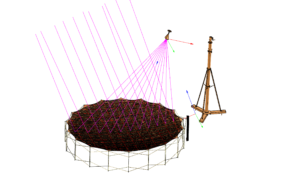
Figure 2 – TICRA Tools RF model of the LEA antenna in RF measurement conditions. Rays coming from the feed and reflected by the reflector are shown in pink.
For the electromagnetic analysis of the reflector itself, TICRA used Physical Optics (PO) from GRASP, a high-frequency approximation method that computes the induced surface currents on the reflector from the incident field of the feed and then integrates those currents to obtain the radiated far field. Physical Optics is highly accurate for electrically large reflectors, where the aperture spans many wavelengths, while requiring significantly less computational effort than full-wave methods.
To verify that PO analysis of the reflector was sufficient, TICRA also performed a full-wave simulation using the Method of Moments with the Multilevel Fast Multipole Method (MoM/MLFMM) solver within ESTEAM. This model included the reflector, truss, feed tower and feed, together with their mutual electromagnetic interactions. The two approaches showed excellent agreement. Differences only appeared below -50 dB relative to the peak gain, well into the noise floor for most applications. On this basis, the truss and feed tower were excluded from the final PO analysis.
What the measurement correlation showed
The comparison between the GRASP predictions and the measured antenna patterns at 10.65 GHz — and at the other two test frequencies — produced consistent and clear results.
The agreement between predicted and measured patterns was excellent across the main beam, sidelobes, nulls and grating lobes down to -40 dB below the peak. The differences in amplitude were well within the estimated measurement uncertainty of ±5 dB at -30 dB from the peak.
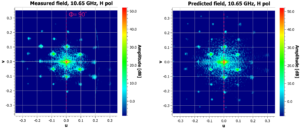
Figure 3 – Amplitude of the co-polar component of the measured and predicted electric field at 10.65 GHz, in Ludwig 3rd polarization for the H-pol feed.
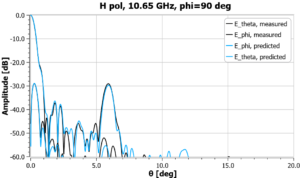
Figure 4 – Amplitude of the co- and cross-polar component of the measured and predicted electric field at 10.65 GHz, in Ludwig 3rd polarization for the H-pol feed and the phi=90 deg plane.
One finding from the correlation exercise deserves particular attention. When TICRA ran the model without the surface points extrapolated on the front tension net, using only the directly measured surface points, the prediction changed significantly. In that case, only the first ring of grating lobes could be predicted. All outer grating-lobe rings disappeared from the prediction entirely, even though they remained clearly visible in the measurements.
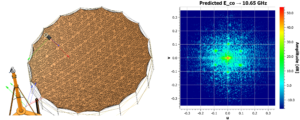
Figure 5 – TICRA Tools model of the LEA antenna using only the measured surface points and no extrapolated points on the front tension net — the predicted field does not recover the measured grating lobes in the second and third ring.
This demonstrated something practically important: accurate knowledge of the reflector surface on the front tension net is essential for predicting the full grating lobe structure. The surface measurement activity for the LEA antenna had not fully captured the tension net surface, so HPS recovered it through extrapolation. That turned out to be not just a workaround — it was the difference between a model that predicted only the first grating lobe ring and one that predicted the complete measured pattern.
Removing the extrapolated tension net surface points from the model caused all outer grating lobe rings to disappear from the prediction. Accurate surface geometry on the tension net is what makes the full grating lobe structure visible to the model.
Carrying the approach forward to Copernicus CIMR
The Copernicus Imaging Microwave Radiometer (CIMR) is a future Earth observation instrument developed under the European Union’s Copernicus programme. It is a passive microwave radiometer, meaning it measures the natural microwave radiation emitted by the Earth’s surface rather than transmitting a signal. The instrument is designed to measure sea surface temperature, sea ice concentration and sea surface salinity with high accuracy and spatial resolution.
The CIMR antenna is a large deployable offset reflector with a projected aperture diameter of approximately 7.1 m, operating across five frequency bands from 1.4 GHz to 36.5 GHz. The instrument will scan conically at 7.8 revolutions per minute from an orbital altitude of 832 km, covering the Arctic and global oceans. At these scales and under these operating conditions, full-scale RF measurements under representative flight conditions are not feasible. The RF model, and the confidence established in its accuracy, is therefore central to the antenna verification programme.
The LEA work provided both a validated modelling approach and a set of concrete lessons about where model accuracy is gained and lost. TICRA carried that experience directly into the CIMR programme.
To validate the CIMR antenna RF model, a 1.4 m representative breadboard of the reflector was built by LSS and measured at Thales Alenia Space Italy (TASI) in Rome in April 2022 using a planar near-field scanner. The breadboard replicates the offset geometry, feed illumination conditions and mesh material of the full-scale antenna at a size that can be measured in a controlled facility.
TICRA built the RF model for the breadboard using the same GRASP and ESTEAM-based approach as in the LEA project, with measured surface geometry from HPS, measured mesh reflection properties from TASI and a measured feed horn pattern. The CIMR mesh uses 25-micron molybdenum-core wires with a 0.2-micron gold coating. The weave differs from that used in the LEA mesh and was characterised separately at each frequency band up to 36.5 GHz.
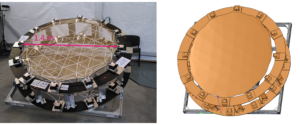
Figure 6 – CIMR breadboard manufactured by LSS and RF model in TICRA Tools developed by TICRA.
The breadboard correlation at Ka-band (36.5 GHz), the most demanding frequency due to the shorter wavelength, showed excellent agreement in the main beam and in grating lobe positions at amplitudes down to -30 dB from the peak. Beyond that level, predicted amplitudes of the outer grating lobe rings were somewhat lower than measured. Investigation traced this to inaccuracies in the surface point data near the net band crossing points and button attachment points on the breadboard. The conclusion was consistent with the LEA experience: RF model accuracy for this class of antenna depends primarily on the accuracy of the surface geometry input.
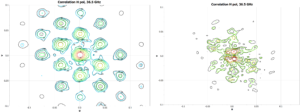
Figure 8 – Measured pattern in black dotted curve, predicted pattern in colored solid curve at 36.5 GHz, H-pol: co-polar pattern on the left and cx-polar patterns on the right.
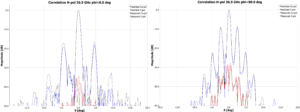
Figure 9 – Amplitude of the measured (black dotted) and predicted (coloured solid) pattern at 36.5 GHz, H pol, for φ = 0°, 90° cut.
TICRA also compared the GRASP equivalent mesh model against a detailed three-dimensional mesh model built in the CST software by Thales Alenia Space Italy. The two approaches agreed very well across the full angular range, with differences of only 0.6 to 0.8 dB in the back lobe region at -40 dB from the peak — contributing just with 0.01 dB to the total directivity. This confirmed that the GRASP equivalent mesh approach, calibrated from normal-incidence reflection measurements, is adequate for this class of problem without requiring a full geometric model of the mesh structure. The detailed three-dimensional mesh model can however predict ohmic losses, which can be of interest in some applications.
What this means for engineers working on similar problems
The results from the LEA and CIMR breadboard programmes are relevant beyond these two antennas. They establish a validated workflow for RF modelling of large mesh reflectors and identify the factors that have the greatest impact on prediction accuracy.
Several practical conclusions carry over to other programmes:
- Physical Optics analysis in GRASP, combined with the equivalent wire mesh model calibrated from normal-incidence reflection measurements, is sufficient for accurate prediction of the main beam and grating-lobe structure. A full geometric 3D model of the mesh weave is not required.
- Surface geometry accuracy on the tension net is the dominant source of uncertainty. Dense and accurate surface measurements of the tension net, not just the reflector surface, determine whether the outer grating lobes can be predicted correctly.
- Structural elements such as the deployable truss and feed tower often have negligible influence on the antenna radiation pattern and can be excluded from the Physical Optics analysis once this has been verified through a full-wave analysis in ESTEAM.
- Breadboard-scale RF measurement is a practical and efficient approach to validating the RF model before the full-scale antenna is built. The CIMR programme used this explicitly as an early verification step.
The CIMR breadboard work was performed from the outset to inform the next phase of the programme. The insights from the correlation study, particularly the need for denser surface measurements around net-band crossings, feed directly into the Engineering Qualification Model (EQM) test plan and manufacturing process. This is the kind of outcome that makes RF modelling practically valuable. It provides not only a prediction of antenna performance, but also actionable guidance on where to focus measurement and verification efforts.
Read the papers
Cappellin, Lori, Geise, Hunscher, Datashvili — “Predicted and Measured Antenna Patterns of the European Large Deployable Reflector.” EuCAP 2022, Madrid.
Cappellin, Nicolaci, Mizzoni, Mangenot, Lubrano, Trippanera, Datashvili, Fiorelli — “RF Modelling and Validation of the Breadboard Antenna of the Copernicus Imaging Microwave Radiometer.” EuCAP 2024, Glasgow.
 |
Cecilia CappellinDirector of Customer Projects and Support Cecilia is TICRA’s Director of Customer Projects and Support and is responsible for TICRA’s R&D and consultancy projects. Additionally, Cecilia manages the Applied Electromagnetics team. |